Mavericks swell: a quick buoy-based look at how extreme it was
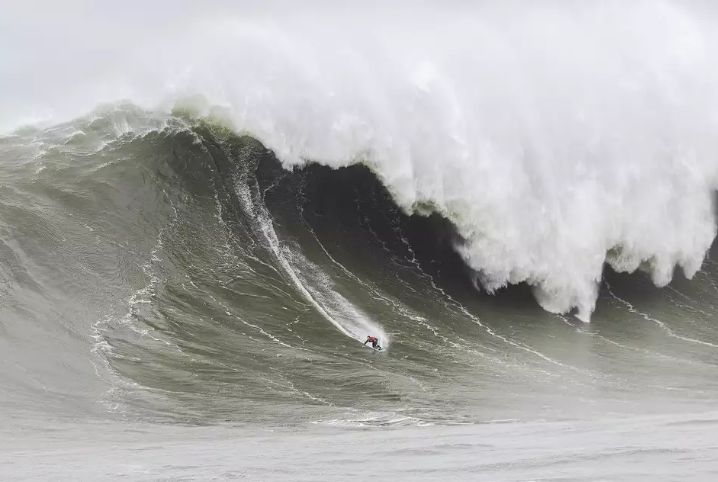
I was in San Francisco when yesterday’s extreme swell arrived, and spent the afternoon watching the big-wave surfers at Mavericks on what some are saying was one of the best days in the spot’s history (example clip).
After gracing the Eddie Aikau big-wave competition on Oahu’s North Shore, the swell slammed into California’s coastline, damaging coastal infrastructure (news report) and necessitating a number of rescues.
I did some quick-and-dirty analysis using data from three NOAA buoys to see how extreme this swell was. The return-interval plots below visualize the summary. The top graph corresponds to the open-ocean buoy and the bottom to the coastal buoy (read wave height on the left y-axis and period on the right). I marked yesterday’s event with dots on the curves.
In the open ocean (NOAA buoy 46006, ~1,335 km WNW of San Francisco), significant wave heights and peak wave periods appear to have topped out around 11.6 m and 22 s, respectively. A basic extreme value analysis suggests these are roughly 1-in-19 and 1-in-24-year events (≈5% and 4% chance in any given year).
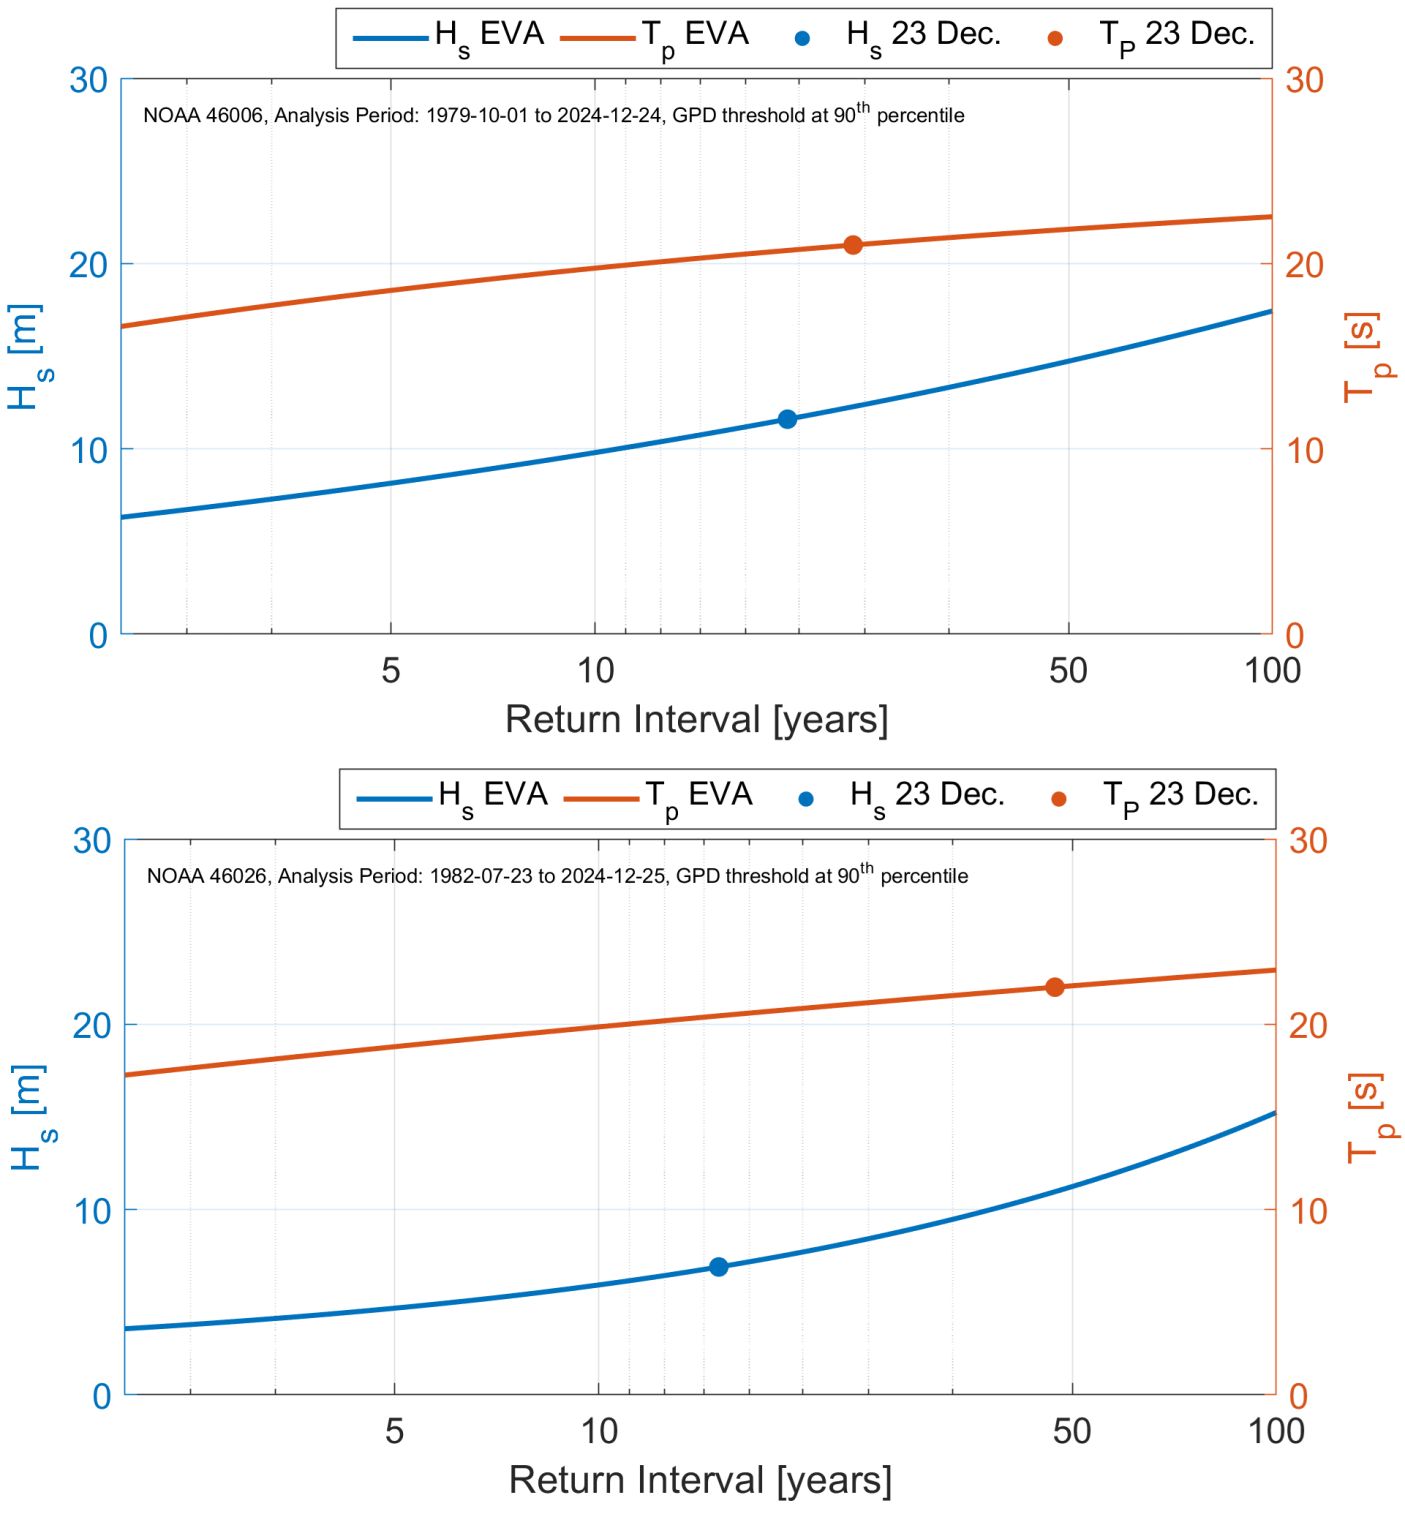
The interesting part was how little energy the swell seemed to lose as it neared the coast. At NOAA 46026 (~30 km west of San Francisco and ~40 km NW of Mavericks), preliminary data show significant wave heights of 6.9 m and peak wave periods of 22 s. Those come out to about 1-in-15 and 1-in-47-year events (≈7% and 2% chance per year).